


CT No.27: We have begun our initial descent
Can't go up and to the right forever

Hello, readers!
If you have ever worked at an agency, consultancy, media company, or brand that makes decisions around content analytics, can you do me a solid and fill out this survey?
Danke.
Also if you haven’t:
The fun thing about running your own shop is that you get to decide exactly what is important to you. For me, that means choosing the types of projects I like and companies I want to work with — and as long as I can make a living, that’s really all I need. I can have the Best Year Ever according to my own internal happiness or the size of my income. Doesn’t matter to anyone but me and my clients.
Of course, have this system of capitalism and investment wherein large businesses have to prove what we’re doing is valuable to others so they can make more more, scale up, etc. But in the age of proprietary digital data where everything is top secret do not look at me just my product but still give me money and trust, companies still have to report on some sort of success metrics to be attractive to investors, shareholders, and it’s always best if you can make those metrics go up and to the right.
I’ve never taken an econ class but I know a thing or two: Growth can’t multiply forever, there are only so many target markets, you can’t please everyone, and at some point you’re going to not grow as fast as you did before.
Unless!
Unless you move the target!
Back in December, Netflix changed its content consumption KPI. Instead of watching a show or movie to 70% completion to count as a View, now Netflix counts a mere two minutes as a view. Yep. If you watch just a titch longer than your average Ramones song, Netflix counts that as a view.
If you’ve been following along, you’ll know that you should never really have a single KPI for content performance, especially not one as razzle-dazzle as view time, but hey! Anything to impress shareholders?
Tyler Coates breaks this down nicely in Wired and says it better than I can.
…Two minutes of The Irishman, which runs three and a half hours, amounts to 0.95 percent of the total film. You’d barely get through the opening tracking shot at the assisted living facility where an aging Frank Sheeran (Robert De Niro) is primed to reflect back on his long life of crime. I like to imagine me, an occasional movie critic, turning off a film after two minutes and writing a review. I mean, according to Netflix’s data, I’ve seen it. Two minutes is enough!
Netflix’s argument is that the new metric is closer to what YouTube and The New York Times counts as a video view. Technically, this is true! If you are measuring for “eyeballs,” then eyeballs you can get for two minutes.
Measuring for eyeballs is for chumps. Especially if you care about content.
Netflix produces a vastly different type of content than The New York Times or YouTube. Adopting any kind of universal standard for “digital video content” is limiting, to say the least. For the past few years, pivot-to-video folks have said things like “70% of all data consumed online is video” to sell itsy bitsy two-minute marketing videos… but they never couple that stat with the fact that professionally produced, sharply streaming Peak TV eats massively more data than anything on TikTok or YouTube (I think? We have begun our initial descent.)
There’s no chance anyone but the PR department is seriously using the two-minute metric. Netflix’s holds reams of highly meaningful data at its fingertips, more than any movie studio. It’s been organized from the start, and they give hints of it every now and then, like when they tell you about how they knew House of Cards would be a hit. (I mean, that was always a no shit, sherlock.)
Netflix’s data informs every creative risk they take, including their confidence in bankrolling stories for diverse audiences that legacy studios and TV networks wouldn’t touch. They have data about how we watch, when we watch, whether we like the shows or not, all that data from the first 10 years of streaming when I rated movies I liked from one to five stars which it does not collect anymore even though I loved that feature.
When companies that excel at data-driven storytelling reduce themselves to reductive single-metric representations, that’s a tell.
Netflix knows the story it’s telling is mindnumbingly limiting, but media companies have never had to share their creative data. Why start now? But I wish they weren’t throwing gas on the analytics business bullshit fire.
Anyway, content and marketing folks: make sure your vendors define their terms. Make your KPIs realistic and actionable. Benchmark like a pro. And even from your best, most trusted vendors — and friends know that I will go to bat for Netflix as a Great Content Company — take it all with a grain of salt.
The good ones don’t want eyeballs. The best ones want minds, motherfuckers!
Err… the best ones want an appropriately sized audience to listen and hear their stories.
It’s been a long week.
In the tradition of other semi-informative line graphs: Pinterest Trends review
Pinterest, another giant repository of consumer taste data, released its Trends tool back in December. Much like its older, far wiser step-sibling, Google Trends, Pinterest Trends displays how consumer topics have historically trended on Pinterest. Cool, right?
The downsides: “Historically” is not an accurate descriptor. Users can only access the past year of data, which means showing annual seasonal trends or almost any time-based comparison. And the data is only from 2019. Like, Google Trends data, it’s only comparative and not absolute.
The big however: When it hangs out with its older, cooler step-sibling, it has a lotta potential.
Pinterest Trends at a glance
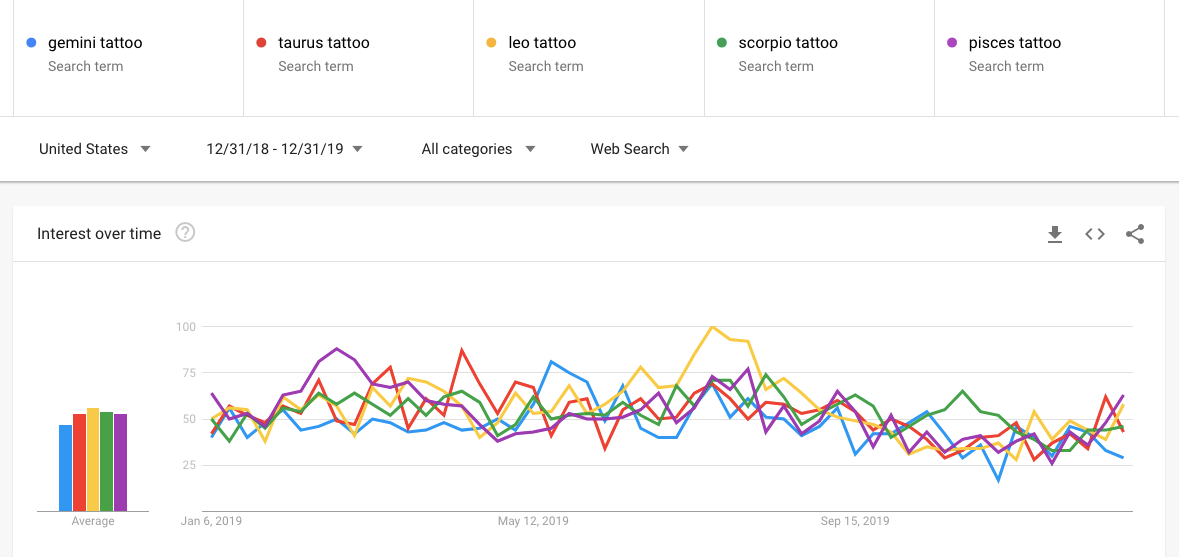
Pinterest Trends enables comparison of up to four Pinterest search terms at a time, so you can see which Zodiac sign’s tattoos are most highly searched throughout the year (Gemini, by a long shot. Followed by Scorpio and Taurus).
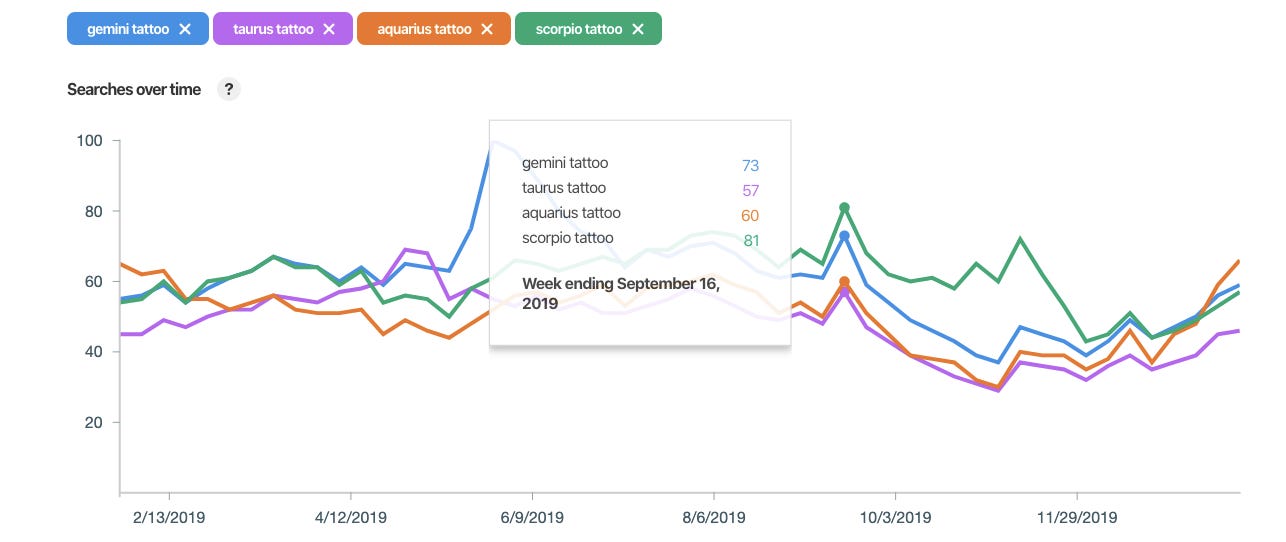
Nerd note: “Cancer tattoo” had to be eliminated from this dataset because of multiple intents.
It’s a cute, fun little story, especially when you look at the spike in the week of September 19. (Can’t find any Zodiac tattoo-related news stories for September and National Tattoo Day is in July, so my best quick guess is those searches were guided by some kind of editorial, most likely on Pinterest itself.)
But when you compare it to search data on Google Trends, you can see more nuances. Leo and Pisces, neither of which made much of an impact on Pinterest last year, are the most two popular Zodiac tattoo in Google for several years running. (Scorpio and Taurus still rate highly). And on September 19, 2019, we can see a small spike in all “[sign] tattoo” searches on Google — although not as high as in previous years.
I’d wager that the equinox inspired some tattoo-related editorial that drove the light spike. The 9/19 spike was higher in 2019 compared to other years because of astrology’s relative popularity.*
It’s a fun little story-theory that’s been incubated for approximately ten minutes.
Alone, the Pinterest Trends data isn’t much fun at all. Kindof like Pinterest. Sure, it’s an idea, but not anything you could actually do anything with.
But Pinterest Trends data is brighter and bolder in the context of Google Trends. And I’ll bite. I’m not gonna use the story to make choices with consequences, but the idea is far more appealing.
Perhaps Pinterest will organize and release more than a year of data. And then we can start making deeper comparisons, distilling thoughts about how people use one search engine compared with another, or a more rudimentary visual search versus a text-based one.
Regardless, the story above has slightly more weight than judging a feature film’s popularity based on on two minutes of viewing. Not a ton, but, like, enough.
*Other data story notes: “Astrology” trends down on Google Trends over time, but more detailed astrology-related phrases. Most people who are interested in astrology don’t search “astrology”; they search “birth chart” and “rising sign” and “pisces tattoo.” And all of these data stories have only slightly
Content tech news of the week
Just one link this week because we have begun our initial descent:
Seven tips for tracking your impact from The News Media Alliance.
Visit The Content Technologist! About. Ethics. Features Legend. Pricing Legend.